In this post I focus on the &chi2 test, it's pathologies, and why it is so useful for a pseudoscientist. The example is lifted from E. T. Jaynes' book "Probability Theory"
The two problems with &chi2 are:
- it violates your strong intuition in some simple cases
- it can lead to different results with the exact same data, binned in a different way
Both of these properties are useful to the pseudoscientist.
Intuition and Chi-square: The Three-sided coin
In each of this case we will have some data, and two models to compare which try to explain the data. Intuition strongly favors one, and &chi2 favors the other. One of my favorite problems is the three-sided coin: where the coin can fall heads, tails, or on the edge. Imagine we have two models for a relatively thick coin:
- Model A: pheads=ptails=0.499, pedge=0.002
- Model B: pheads=ptails=pedge=1/3
And we have the following data:
- N=29: nheads=14, ntails=14, nedge=1
Which model are you more confident in? Model A of course! If we use the &psi-measure for goodness of fit with these two models, as defined in my prior post, then we have (remember: smaller &psi means more confident in the fit, just like smaller &chi2):


with &psiB-&psiA=26.85 which makes model A more then 100 times more likely than model B (a &psi difference of 20 would be exactly 100 times). Perfectly reasonable. What about &chi2?
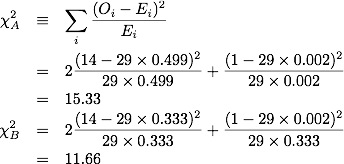
which makes model B slightly preferable to model A! Amazing! Where is this coming from? Apparently it is coming from the somewhat rare event of an edge-landing. If our data had been instead
- N=29: nheads=15, ntails=14, nedge=0
then we'd have
- &psiA=0.3
- &psiB=51.2
and
- &chi2A=0.093
- &chi2B=14.55
where now both measures agree that model A is superior.
| Why do pseudoscientists love the &chi2 test? |
| Answer 1: Because all they need to do is wait for that inevitable, somewhat rare but still possible, data point and &chi2 yields a pathologically high value |
The &psi-measure and log-likelihood
To understand the other problem with the &chi2 test we need to understand what the &psi-measure is doing. As above, imagine we have a set of observations Oi. We define the total number of observed points and the relative frequency of each observation,

The maximum likelihood solution for the probabilities of observing Oi for each class, i, is just the relative frequency of each observation. This is the "just-so" solution, where we estimate the probability of seeing 14 heads in 29 flips as p=14/29. This "just-so" solution will have the closest match, and the highest likelihood (by definition). If we have a model which specifies a different set of probabilities for each class, then it's likelihood is simply

The &psi measure can be rewritten as

So you can think of the &psi-measure as comparing a model with the "just-so" solution (which has maximum likelihood). Further, subtracting one value of &psi with another (for different models) performs the log-likelihood ratio between the models. A proper analysis should include prior information, which can be done almost as easily.
An almost equivalent problem
Imagine that we have a coin with 6 faces, and we are comparing the following models:
- Model A: p = [0.499/2, 0.499/2, 0.499/2, 0.499/2, 0.002/2,0.002/2]
- Model B: p = [1/6,1/6,1/6,1/6,1/6,1/6]
And we have the following data:
- N=29: O=[7,7,7,7,0,1]
where I have listed the probabilities and the outcomes for each face. Notice that, grouping them together in pairs we retrieve the same as the first example. Thus when comparing the two models, with this equivalent problem, we should get the same value. Because the size of the problem changed, the individual &psi values will be different (larger) because there are more terms in the "just-so" solution. However, the difference between the models should be the same. The results are:
- &psiA=11.35 (old value 8.34)
- &psiB=38.2 (old value 35.19)
with &psiB-&psiA=26.85 (old value 26.85...the same!), and
- &chi2A=32.6 (old value 15.33)
- &chi2B=11.76 (old value 11.66)
The &chi2 for one of the models (Model A) has been inflated quite a lot relative to the other model. This means that, depending on how you bin the data, you can make whichever model that you are looking at more or less significantly different, without changing the data at all.
| Why do pseudoscientists love the &chi2 test? |
| Answer 2: Because all they need to do is bin their data in different ways to affect the level of significance of their model over the model to which they are comparing |
Still taught?
So, why is the &chi2 test still taught? I don't know. It has pathological behavior in simple systems, where somewhat rare events artificially inflate its value, and it can be easily used to prop up an unreasonable model simply by rearranging the data. Why not teach something, like the &psi-measure, which is grounded theoretically in the likelihood principle and does not have such pathological behavior? If you prefer to use the log-likelihood instead, then that would be fine (and equivalent).
I think it is about time to purge the &chi2 test from our textbooks, and replace it with something correct.
No comments:
Post a Comment