Introduction
I saw in the newspaper an article about a supposedly
psychic octopus, which predicts world cup matches by making a choice between two different foods labeled by the team flags.
Paul the Octopus has an impressive record of 12 correct out of 14. Or is it impressive? How can we determine whether this performance is evidence for psychic behavior, or something else. A typical statistical analysis might start with the null hypothesis that the octopus was random, so was choosing the teams with probability p=0.5. The likelihood of getting 12 right in 14 is
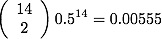
which is fantastically strong against the null! Even if you do the p-value test for the the correct data being more extreme, you get p-val=0.00646.
So, we reject the null, and the octopus must be psychic!...(or not)
Bayesian Analysis Against Random
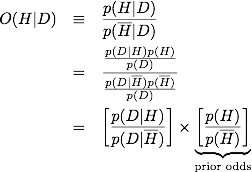
Let's look at this another way, and perhaps we can gain some insight. It will be convenient to talk about odds, rather then probability, and further to use the log of the odds so that this becomes an arithmetic problem. The odds is defined as the ratio of the probability for a hypothesis, H, and the probability for the inverse, not H.
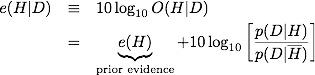
We define the log-odds, or evidence as defined by E. T. Jayes,
A few comments before we commence with more calculation. The prior evidence reflects our state of knowledge before we see the data. How likely is it that an octopus is psychic? Most reasonable people would say highly unlikely. Generous odds would be 100:1 against, although personally I'd probably put it at least a million to 1 against. Let's be generous. That gives us a prior evidence of
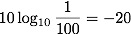
If we had been naive, and set equal odds, then this evidence would be e=0. So we start with evidence e=-20 for a psychic octopus (which is strong evidence against it, because e<0), and then we observe the data. If we assume that a psychic octopus is right 90% of the time, and that the only alternative is a random octopus correct 50% of the time, then we have added evidence for each correct answer:

Each incorrect answer gives:
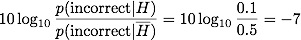
The evidence gets pushed up from the prior with each correct answer, and down for each wrong answer. Notice how wrong answers are penalized more than right answers. This is because the psychic octopus is pretty good (p=0.9). We get a final (posterior) evidence for 12 correct and 2 wrong:

which is about 2:1 odds against the psychic octopus.
More to the Story
Most pseudoscience gets propagated by people who reason naively. They will say that there are two possibilities, say random and psychic, and they they must both be equally likely before the data. So, when rare data is found, they reject random and claim this is evidence for psychic phenomena. This line of reasoning is incorrect for two reasons:
- random and psychic are not equally probable a priori - random is much more likely in cases like this
- there are more possibilities
We already saw how point (1) can be handled by proper prior information. Point (2), with multiple hypotheses gets mathematically a bit trickier (there are more terms to carry around) and is thus messier, but conceptually is fairly straightforward.
We have two hypotheses so far:
H="Octopus sees the correct future 90% of the time, and is psychic"
R="Octopus chooses randomly."
Let me introduce two more hypotheses.
Y="Octopus chooses flags with big yellow stripes 90% of the time"
G="Octopus chooses Germany 90% of the time"
How would you choose the prior probabilities for these hypotheses? Personally, as I said before, I'd have p(H) way below p(R) by about a factor of a million, but being generous, let's put it about a factor of 100. What about p(Y) and p(G)? I'd say that these might be comparable to random or, if I knew something about the vision of octopi or how the person feeding the octopus might rig the food in the direction of his favorite team, I might even have p(Y)>p(R) or p(G)>p(R). Certainly p(Y)>p(H) and p(G)>p(H). So what happens with the data?
For hypothesis Y, there are N=14 games of which the octopus chooses 12 with bright yellow stripes (there is one where it chose Germany over Ghana and should have chosen Ghana which has a bigger strips, and another with Germany and Spain where Spain should have been chosen). For hypothesis G there are N=14 games and the octopus chooses 12 for Germany (2 teams are chosen that are not Germany, and one match where Germany wasn't a choice and it chose Spain, which has the closest flag).
Thus, the data support both of these hypotheses exactly as much as the p=0.9 psychic hypothesis. Therefore, the evidence will push these hypotheses up by as much as the psychic, over the random, and will make the psychic octopus even less likely.
So, when you hear fantastic claims supported with a comparison to random, the two things you must do are:
- Ask yourself what the prior probability of the fantastic claim is. Even if a random explanation is very rare, it will probably still be favored against the fantastic claim.
- Ask yourself what other possibilities, even if unlikely, could explain the data. Since the fantastic claim is exceedingly unlikely, even somewhat unlikely explanations may be supported by the data more than the original fantastic claim.